NUS BMS5121 · Prototype Sprint · Group 1 · 2026
Kopi & Co
Forty minutes is not the limitation. It is the design brief.
A decision-support prototype for a regional café operator: turn twelve weeks of outlet data into a Monday operating conversation that can be inspected, challenged, and used.
- 40
- minutes to prepare
- 42
- outlets reviewed
- 12
- weeks of data
- 03
- decisions to make
Your turn: take the brief into the decision episode ↗
Reading tools / Understand & connect
A few ideas inside this story.
Open a concept to see its meaning here, then follow a related question into another field.
Constraints
A limit changes which choices are actually available. Start with the feasible set before looking for the most attractive answer.
In this story: One bounded Monday decision, rather than an unlimited wish list.
- The cost of a stop. A tyre advantage has to repay a stop before the laps run out.
- Prepared, still uncertain. Preparation still has to meet the right opportunity window.
Evidence
Separate an observation from an interpretation and a model. Each can be useful, but they support different kinds of conclusions.
In this story: Inspect the published prototype screens and their stated scope.
- The cost of a stop. Check the race reports separately from the illustrative model.
Trade-offs
Improving one thing can cost another. Make the exchange visible before treating a choice as an improvement.
In this story: Keep priorities and constraints visible when choosing what to address.
- The cost of a stop. Exchange immediate track position for a different pace profile.
Iteration
A useful next attempt changes something for a reason. Keep the observation that led to the change, not just the latest result.
In this story: Follow the lessons from building and checking the prototype.
- Prepared, still uncertain. Separate what to improve next time from what chance controls.
Model boundaries
A model answers the question it represents. State what it leaves out before carrying its result into a real decision.
In this story: An academic prototype is not evidence of a deployed business result.
- The cost of a stop. A projected catch is not a predicted pass or victory.
- Prepared, still uncertain. Hypothetical per-window inputs are not measured fish catch rates.
The brief
One morning. Three decisions.
At 9:00 on Monday, Priya receives the operating workbooks. At 9:40, she chairs the meeting. The prototype does not attempt to explain everything in between.
It creates a defensible shortlist, shows the evidence behind each flag, and lets the manager interrogate the business rules before acting.
- 01
Which three outlets?
A small intervention queue, not a wall of metrics.
- 02
Where should labour hours move?
Use weekly evidence to support a bounded review of hours for the coming fortnight.
- 03
Which product lines need action?
Distinguish Review from Pull using the final group's explicitly synthetic product data.
The operating surface
Three screens, one line of reasoning
The workflow moves from prioritising visits, to inspecting evidence, to interrogating policy. Retuning the rules closes the loop: all 42 outlets must be evaluated again. These are interaction steps supporting the three business decisions above.
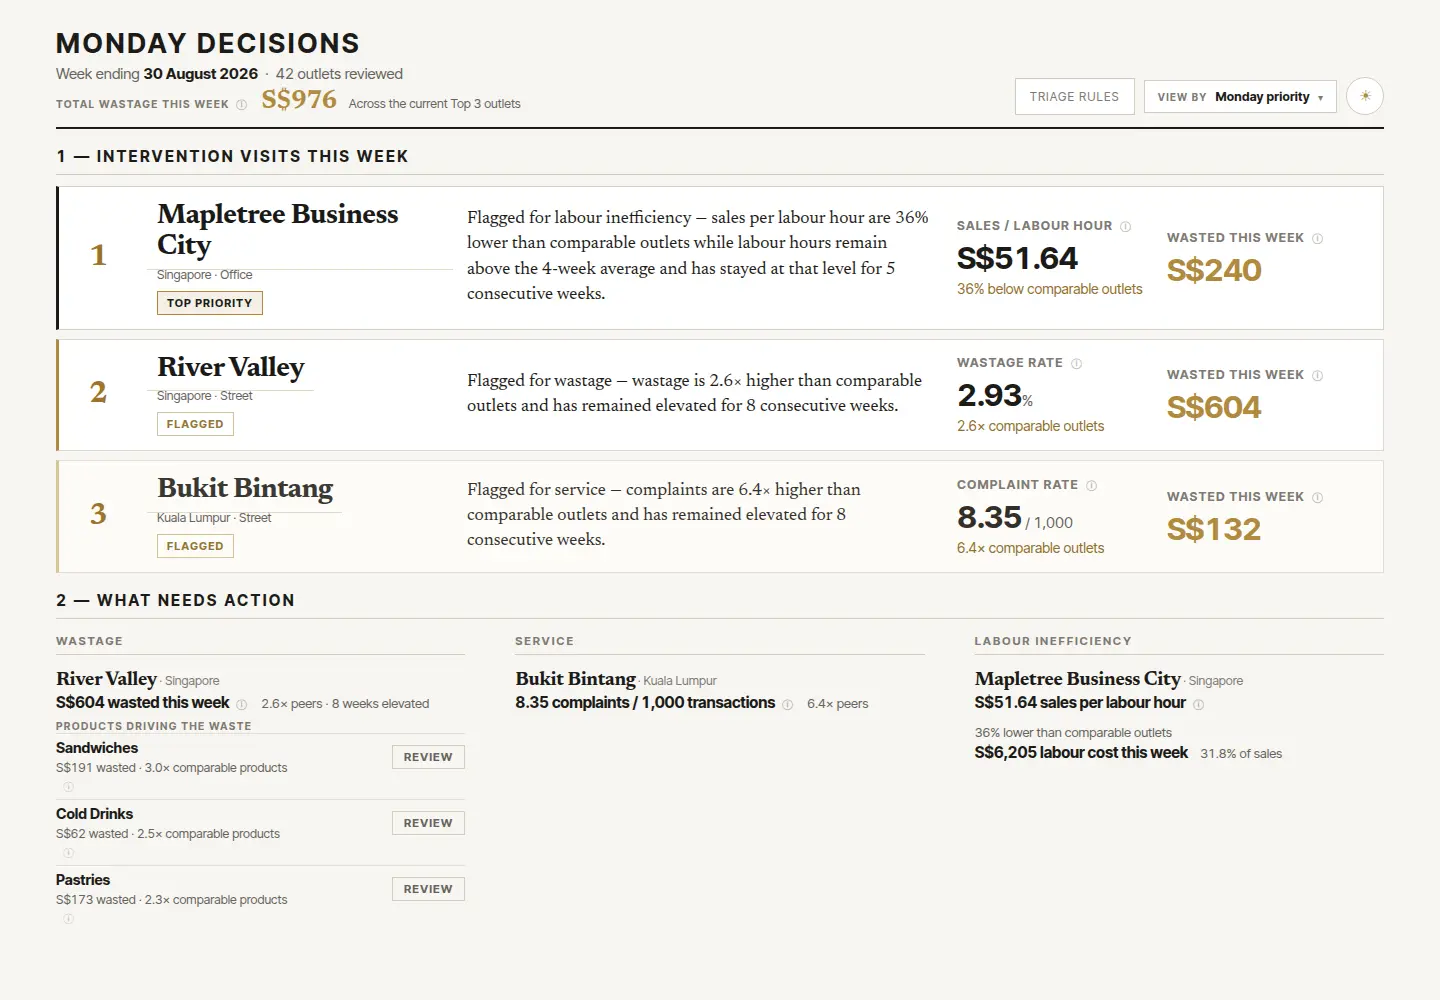
Monday decisions
The network collapses into three intervention visits, each with one reason and the number that proves it.
Download this screen ↓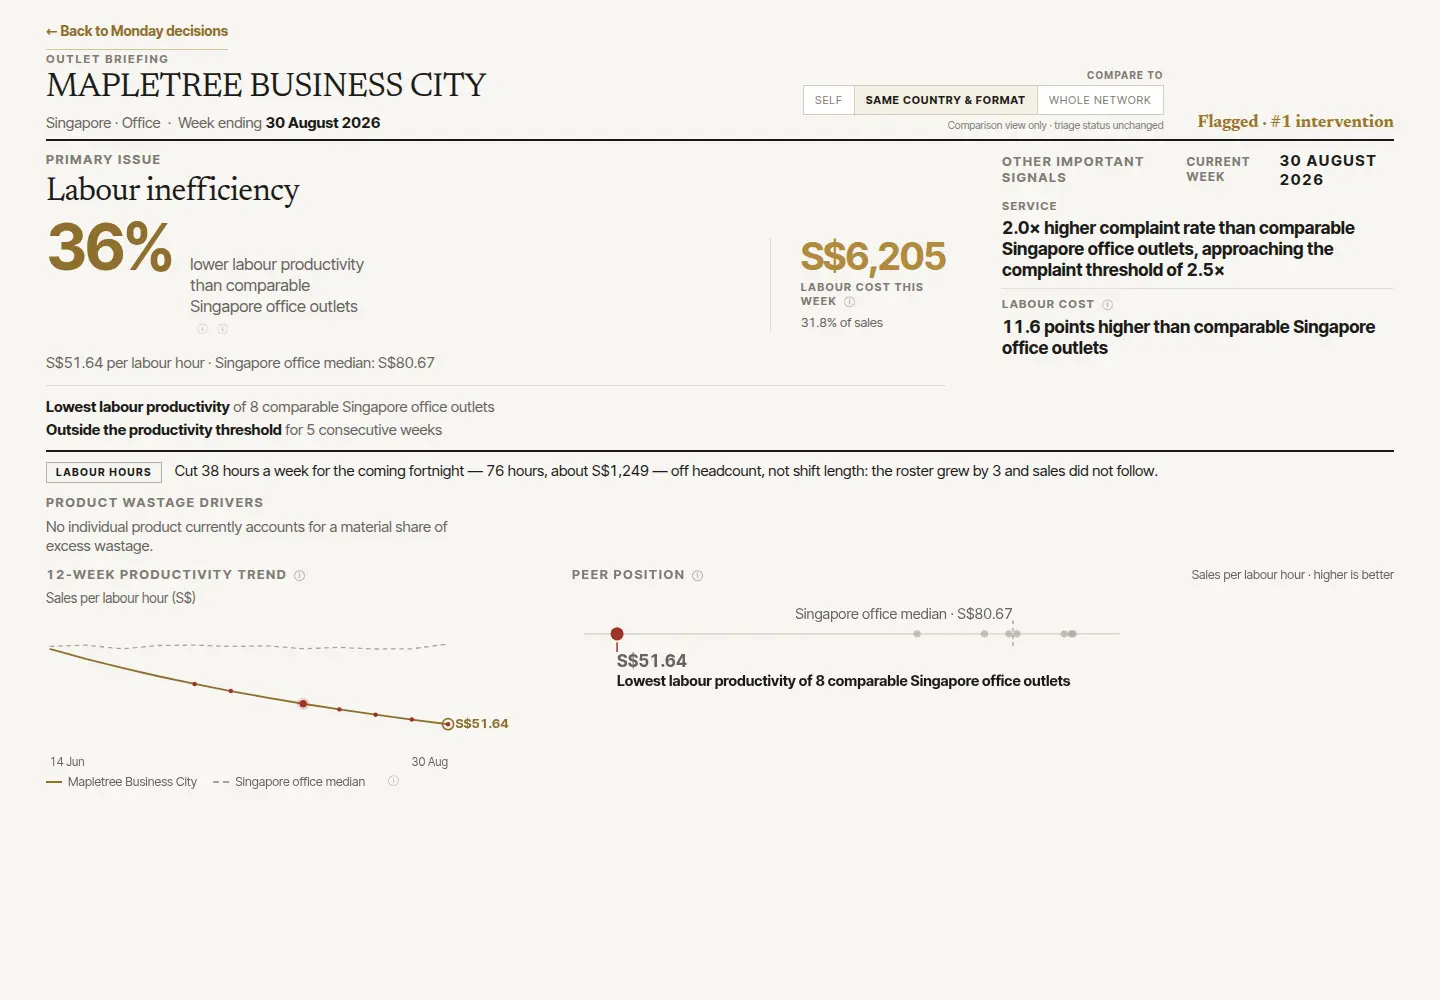
Outlet briefing
A flagged outlet can be read against its own history, comparable peers, or the whole network. The lens changes; the flag does not.
Download this screen ↓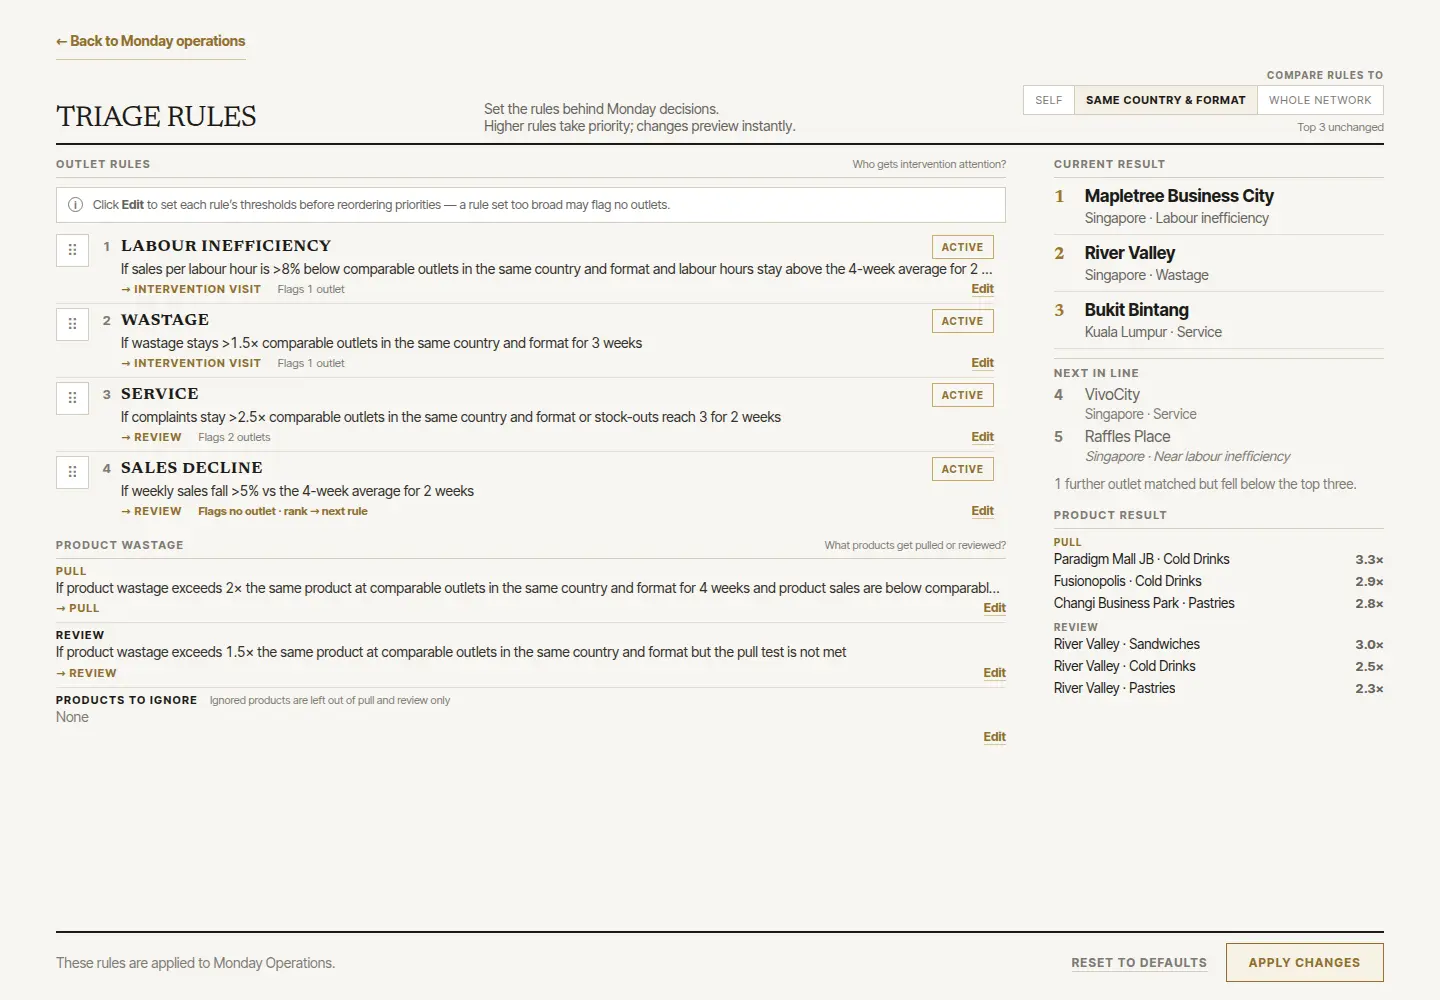
Triage rules
Business-readable rules show what they catch. Priya can reorder or retune them, preview the new shortlist, then apply or reset.
Download this screen ↓PROCESS ARCHIVE / MATERIAL TO JUDGMENT
Open the process, not just the finished screen.
Four stops through the material, my branch, the group submission and the questions I took away. Select a stage to see the reasoning and its source.
504 × 15
Before the screen, read the table.
42 outlets × 12 weeks = 504 outlet-week records.
The starting dataset had 15 fields. Each row described an outlet in a week, which made the unit of analysis a useful first question: what could this row actually tell a manager?
It could help identify outlets worth a closer look. It did not contain the product-level evidence needed to identify a particular product line to withdraw. That distinction shaped my early branch before there was a more elaborate interface.
V0 / PERSONAL
Give each recommendation a defensible starting point.
An individual branch within a group project.
I checked the schema and explored a personal V0 branch around outlet attention and the limits of the available evidence. The question became more useful when I stopped treating three finished screens as the whole task and asked what each screen should help someone decide.
A ranking needs a reason for attention. A labour signal needs a follow-up question about feasibility. A product decision needs evidence at product level. Those are different tasks, even when the interface puts them close together.
3,024 × 22
A richer final artifact, with its own data version.
The submitted prototype uses 3,024 synthetic product-level records across 22 fields.
The final group artifact expanded the demonstration to product-level data. The three screens let a manager move between the attention list, an outlet briefing and adjustable rules. The screenshots and working prototype on this page are that shared submission.
The datasets belong to separate versions: their outlet IDs are not a continuous observation history. Within the product table, an outlet-week total can also repeat across product rows. Counting those repeated totals six times would change the business question rather than answer it.
QUESTION → CHECK
A convincing demo still needs questions.
Later reflection connects problem framing, evidence and interaction.
Revisiting the project for managerial problem solving made the decision process easier to describe. I can separate the original material, my early exploration, the group’s final artifact and the later interpretation without flattening them into one story.
The next check I would carry into a similar project is concrete: change an input, follow the rule, then inspect the recommendation. If the result stays the same, is that a justified outcome or a calculation that never changed? That question connects this case to the requirements and systems work elsewhere on the site.
Drawn from submitted project material, the contribution record and later reflection. Screenshots and the prototype show the group submission; this section is retrospective commentary.
KOPI / ONE STEP BEYOND THE ORIGINAL
What does the evidence support?
Follow the questions from my individual reflection. Change the decision conditions and inspect what can be done now and what is worth asking next.
Enter the evidence studio ↗- 01 / Choose a question
- 02 / Inspect what evidence it needs
- 03 / Keep the reasoning and compare versions
Group submission / Working prototype
Take the Monday meeting into your own hands.
Explore our group’s final submitted prototype, with its original English interface and synthetic data. Open an outlet, change the comparison, then adjust a rule and follow the shortlist.
- 01 / PRIORITISE
Which three outlets first?
Read why each card made the list. Use View by to compare the metric rankings.
- 02 / INVESTIGATE
A trend or a peer gap?
Open an outlet name and switch between Self, Same country & format, and Whole network.
- 03 / CHALLENGE
Change the rule. Follow the consequence.
Open Triage rules, edit a condition, preview and apply. Recalculation was a particular focus of my review.
What we got wrong
The prototype improved when we tested its claims, not its appearance.
- 01Computation
A dashboard that only looked live
The first interface recycled the same Top 3 after rule changes. It looked dynamic while the shortlist was effectively fixed.
Correction: rebuild the ranking from the full dataset whenever data or rules change. - 02Interaction
Design logic fought user logic
The engine required thresholds to flag outlets before priority could rank them. A manager naturally tried changing priority first.
Correction: provide sensible defaults, on-page guidance, and a live consequence preview. - 03Evidence
The data could not support every answer
Outlet-week data could locate wastage and labour problems, but not name a product or construct a shift roster.
Correction: enrich the product layer transparently and bound labour advice to weekly hours.
Evidence boundary
Decision resolution cannot exceed data resolution.
Product
Can establishThe outlet-week data can identify abnormal wastage.
Cannot establishIt cannot identify a product line.
Design responseA declared synthetic product layer supports Review / Pull decisions without pretending it proves causality.
Labour
Can establishWeekly outlet data can identify labour inefficiency.
Cannot establishIt cannot produce a shift-, role-, or employee-level roster.
Design responseThe screen proposes a bounded weekly-hours ask; the manager owns implementation.
The tool should prioritise attention, not replace management judgement.
My contribution: the discipline behind the screen
My personal prototype branch focused on problem framing, analytical rules, AI-assisted iteration, and critical review. The three screens shown in this case belong to the shared Group 1 final submission.
Keep the evidence fixed
I held the personal branch to its 504-row outlet-week dataset, distinguished flagging from ranking, and challenged product or roster recommendations that the available fields could not justify.
Challenge the AI output
I audited formulas, rule behaviour, explanations, charts, and interaction states. Corrections included complaint tie-breaking, an inflated percentage, an inappropriate negative chart axis, and wording that overstated the shortlist.
Make the reasoning presentable
I worked on structured prompts and presentation framing. Later reflection revisited the information gaps and workflow; those retrospective interpretations are distinguished from methods documented during the original sprint.
Three versions, clearly separated
Personal prototype
A fixed synthetic outlet-week dataset: 504 observations across 42 outlets and 12 weeks. Its outlet IDs and results belong to that branch.
Group 1 final
A separate synthetic master dataset: 3,024 product-level rows, 22 fields, and six product categories across 42 outlets and 12 weeks. It contains 28 Singapore, seven Johor Bahru, and seven Kuala Lumpur outlets. Outlet IDs differ from the personal branch, so this is not a simple extension of the same CSV.
Later reflection
The subsequent managerial problem-solving case re-examined the project. New analytical framings are retrospective, rather than claims about how the original sprint was conducted.
Process / attribution
Process and AI disclosure
This was an AI-assisted prototype sprint. The team used generative tools for implementation, revision, prompt engineering, and presentation production, while recording the prompts, failures, corrections, and human decisions in the submitted declaration.
The most important work was evaluative: rejecting unsupported precision, correcting examples against the data, separating observed evidence from management judgement, and testing whether the interface actually recomputed its decisions.
The figures pictured here belong to the final group’s synthetic product-level dataset. They are not live operating results, and they should not be read as results from my earlier personal dataset.
MATERIAL GUIDE / FOLLOW THE WORK
Open the material behind the case.
Each entry identifies the kind of material: an experience record, a submitted artifact or a later method example.
The working prototype
Explore the final group prototype with its synthetic product data.
Open material↗02 / Contribution recordMy work and the version history
Read the personal branch alongside the group submission and authorship notes.
Open material↗03 / RetrospectiveThe process archive
Follow the initial dataset, personal V0, final group artifact and later reflection.
Open material↗Enter the exhibition and compare the interface with an original model figure ↗
AFTER READING / THE CONVERSATION
What would you add?
Add an experience, ask a question or point out a correction. Both language editions share this article’s discussion.
Public comments are not open yet. Keep a draft on this device, or send your thoughts through the contact page.
Write a local draft
Only “Save on this device” stores the draft. Clear it on shared devices; it is not published automatically.
0 / 1600